Hidden cost of leverage in LETFs
Leveraged ETFs (LETFs) have exploded in popularity among retail. If you want 2x Tesla, 3x QQQ, or levered bitcoin, there is now a fund for it. Because they trade like ordinary ETFs, buyers evaluate them the same way: look at the chart and the expense ratio.
We analyzed 109 long-only LETFs covering more than $100 billion in assets. The average expense ratio is just 90 bps. However, that number understates what holders actually pay.
Most underperformed — simply holding the underlying would have done better. Leverage actively destroyed value. The standard explanation is volatility drag: daily resets lose ground in choppy markets. That is real, but it is only half the story.
The other half is financing drag. It does not appear in the expense ratio. Nor is it disclosed in any standardized way.
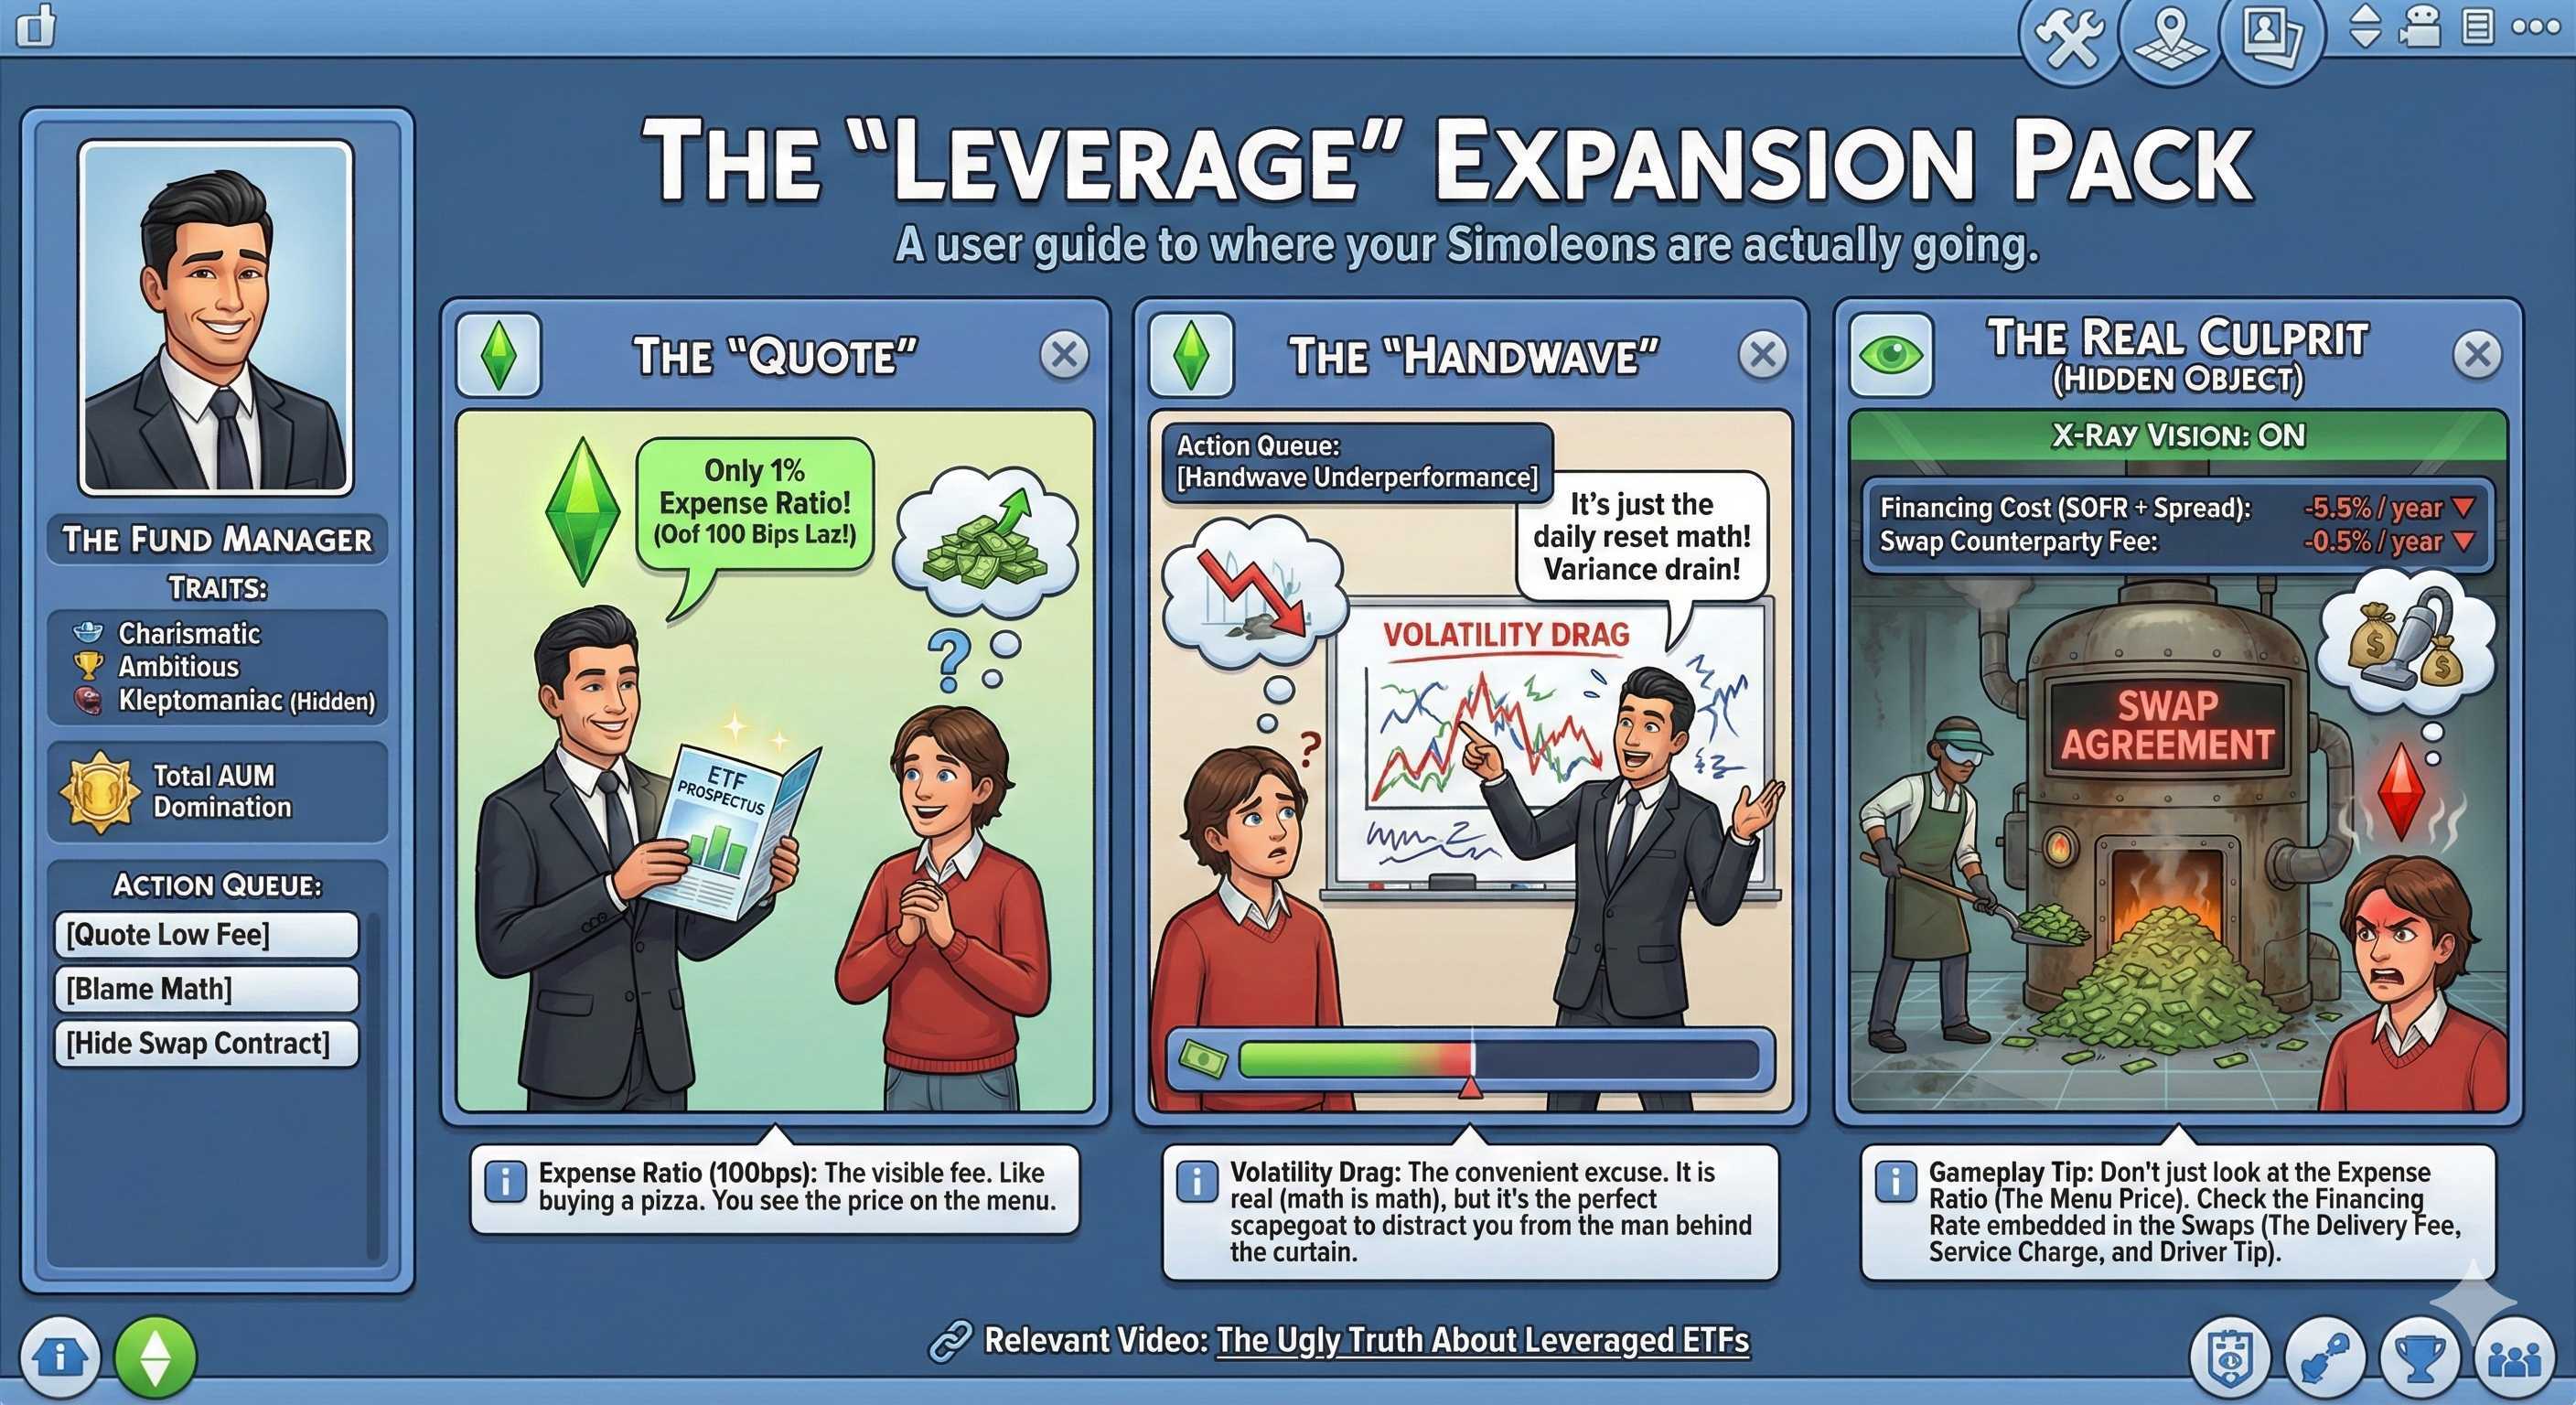
Firstly, how do these funds get leverage?
A 3x fund that has $100 of investor capital needs $300 of exposure. It gets the extra $200 through total return swap agreements with swap dealers. The dealer provides the leverage in exchange for a financing rate. What’s actually paid only shows up in the price chart.
We measured it. For each fund we compared the actual return against what a version borrowing at the risk-free rate would have delivered, net of the stated expense ratio. The residual is the financing premium: the hidden cost of leverage paid entirely by ETF holders.
The premia vary enormously. And they do not track the underlying’s volatility.
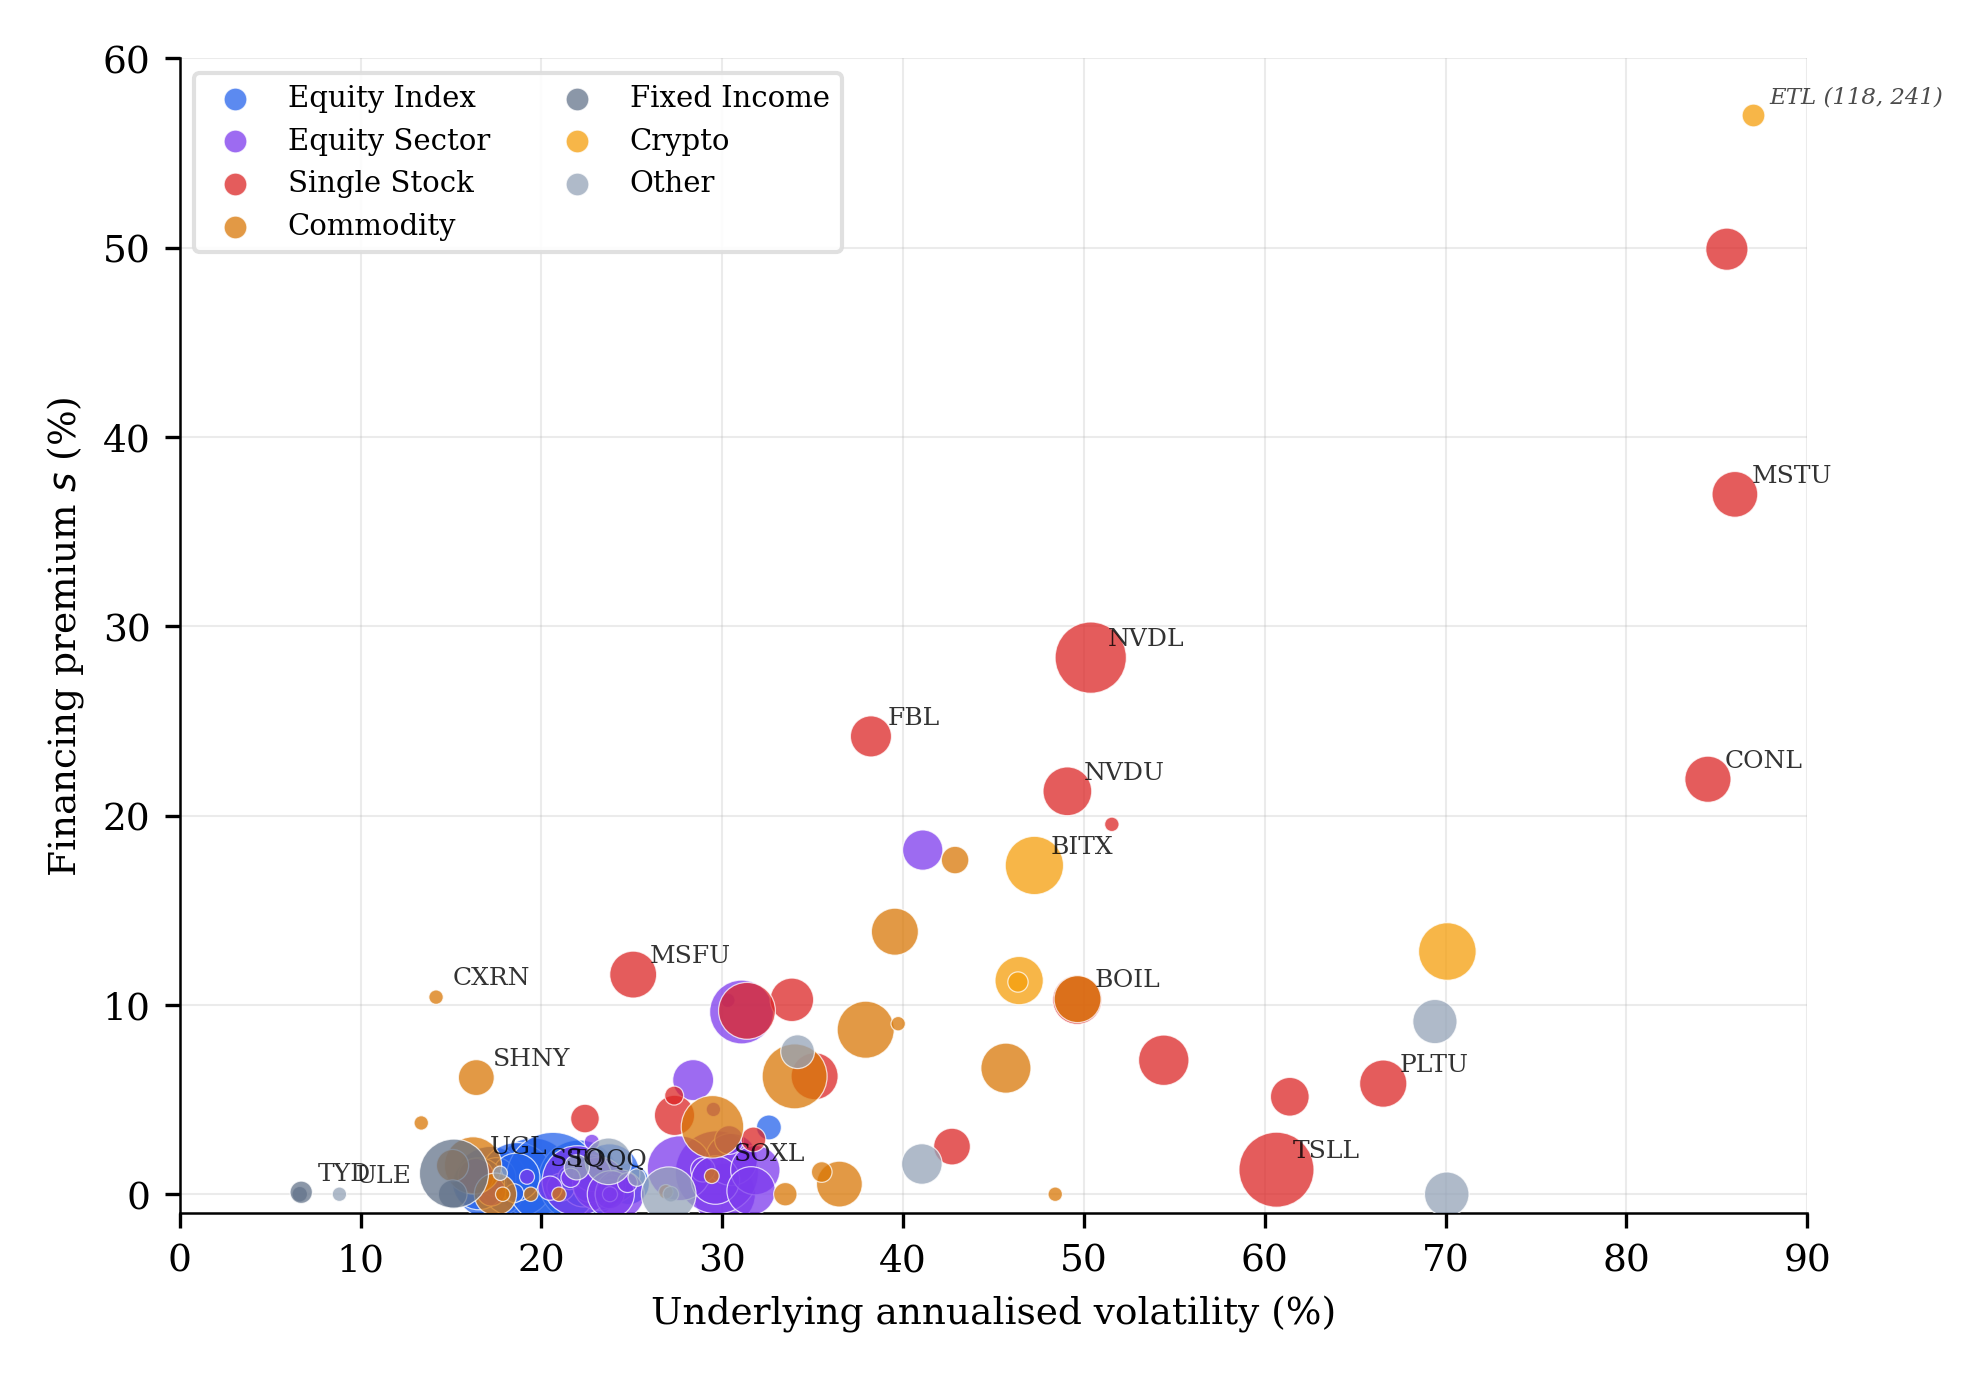 The financing premium does not move with volatility.
Rather, they track the underlying’s hedging infrastructure. Swap dealers who can offload risk onto deep derivatives markets offer lower rates. Where those markets are thin, the dealer’s hedge is harder and the premia are high.
The pattern is clear when we group by asset class.
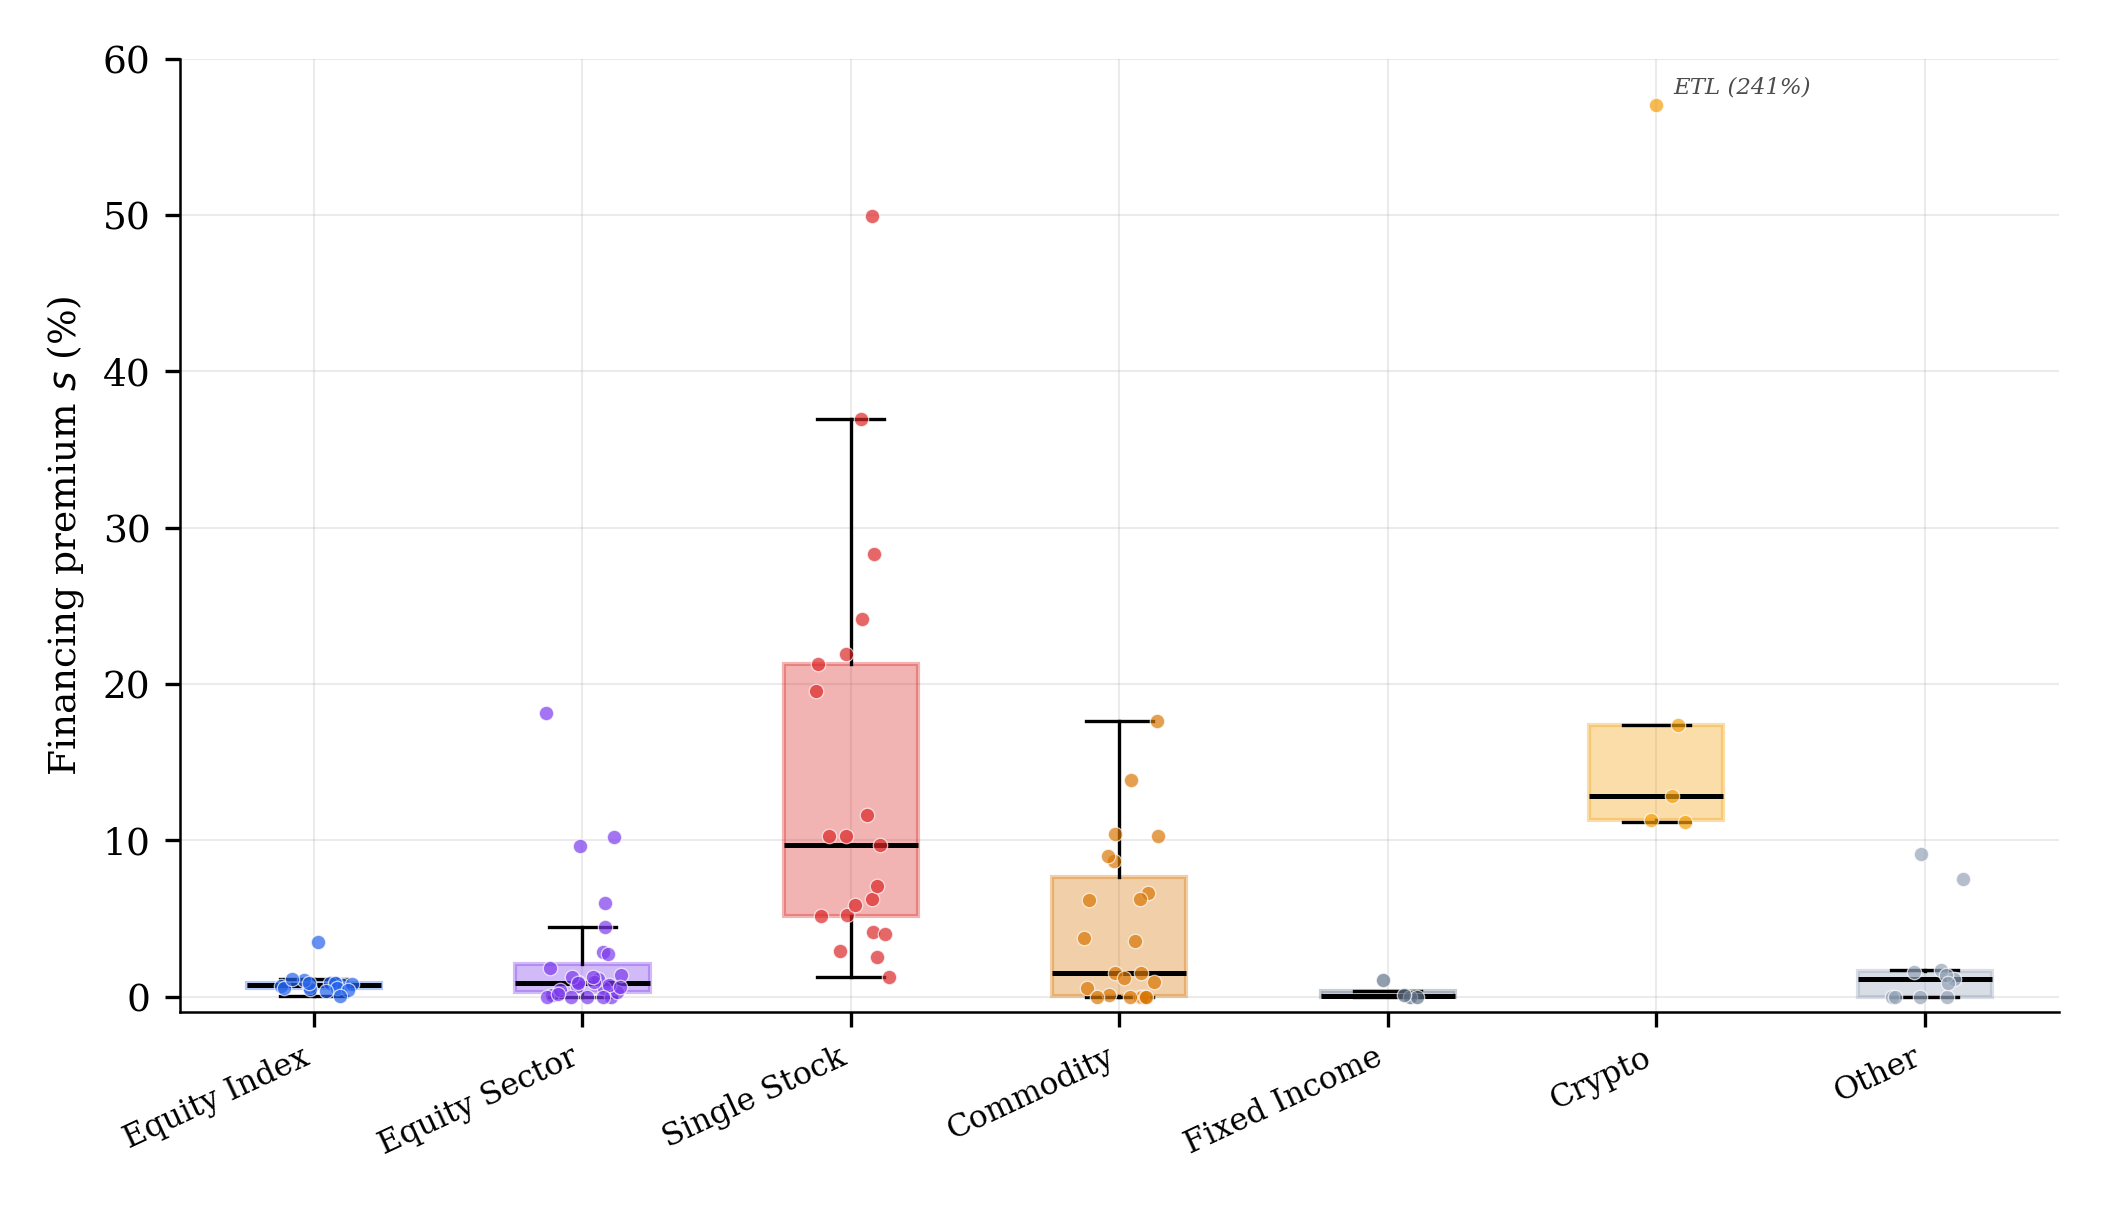 Asset class is the dominant predictor of financing premium.
Deep futures markets make equity index and fixed income funds easy to hedge — the premia are low and tightly clustered. Sector funds cost more; a semiconductor basket is harder to offset than the broad index. Commodities split in two. Gold and crude oil sit in the low group. Others like uranium and natural gas are all over the map.
Single-stock and crypto funds are where costs climb. The dealer hedges in thinner, more fragmented markets — and the premia are both high and widely dispersed.
Where hedging is easy, leverage is cheap;
when hedging is hard, leverage cuts deep.
Take TSLL (2x Tesla) and MSTU (2x MicroStrategy). Both single-stock LETFs. Comparable volatility. But TSLL’s premium is 1.30% and MSTU’s is 37%. Nearly 30x higher.
Tesla has one of the deepest single-stock derivatives markets in the world — liquid options, deep borrow market, plenty of ways to hedge at scale. MicroStrategy has a thinner options book and harder-to-source hedges. The dealer passes the costs through.
The drag on LETF returns comes from both the stated expense ratio and the hidden financing premium. Together they compound over long durations, eating into performance and in some cases destroying value and making leverage counterproductive.
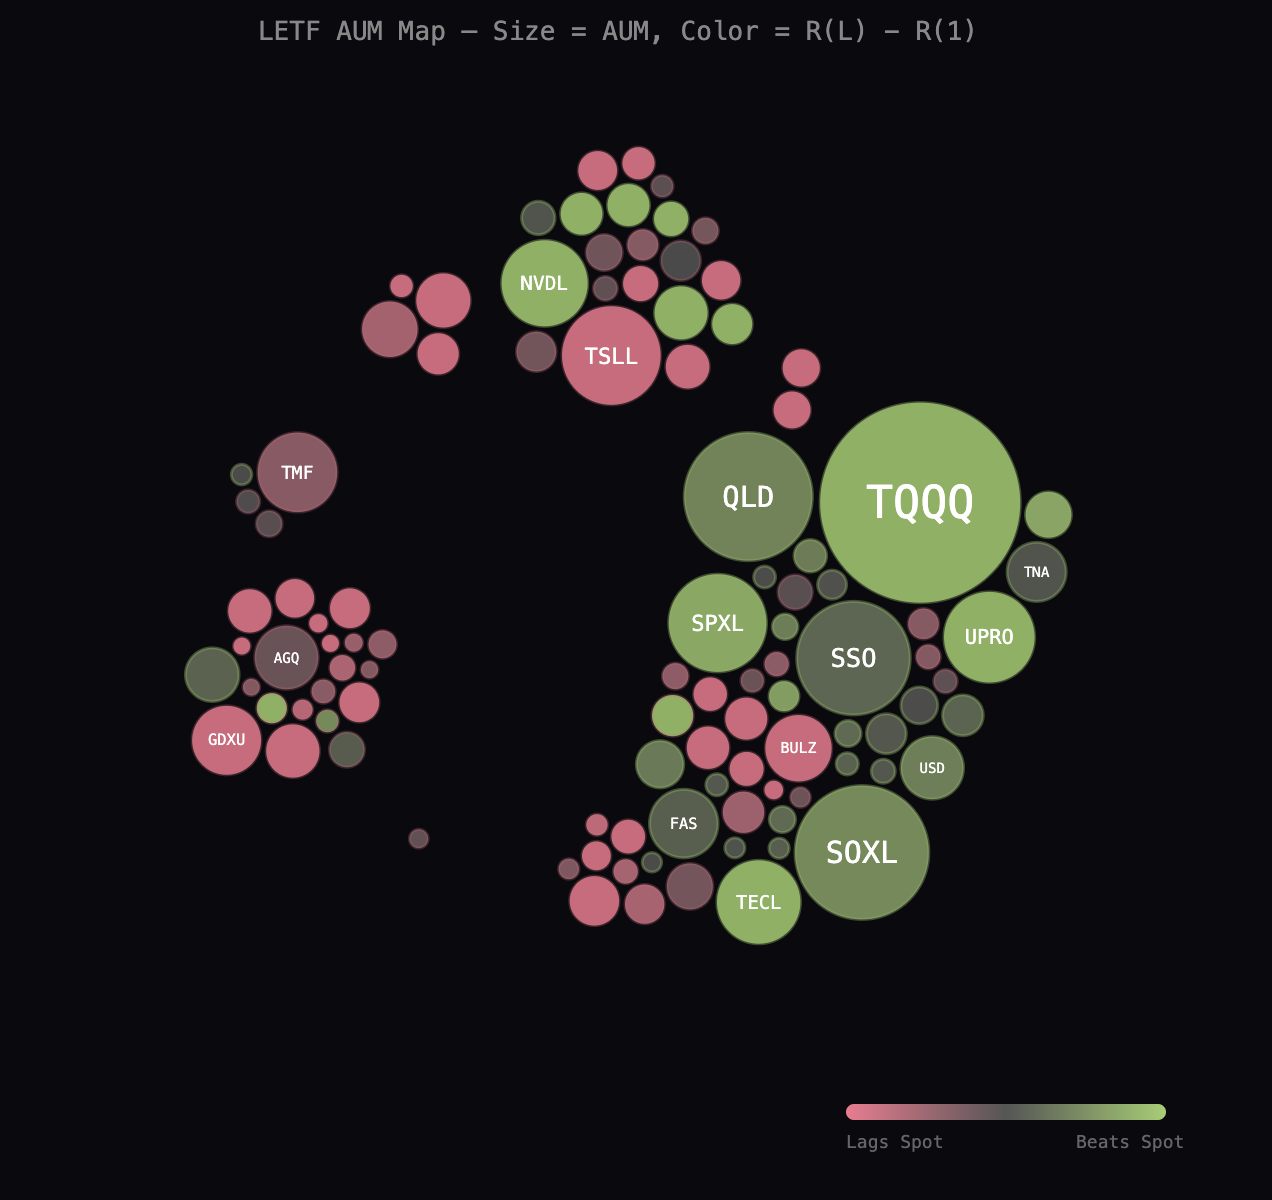 Size = AUM. Green beats the underlying, pink lags it.
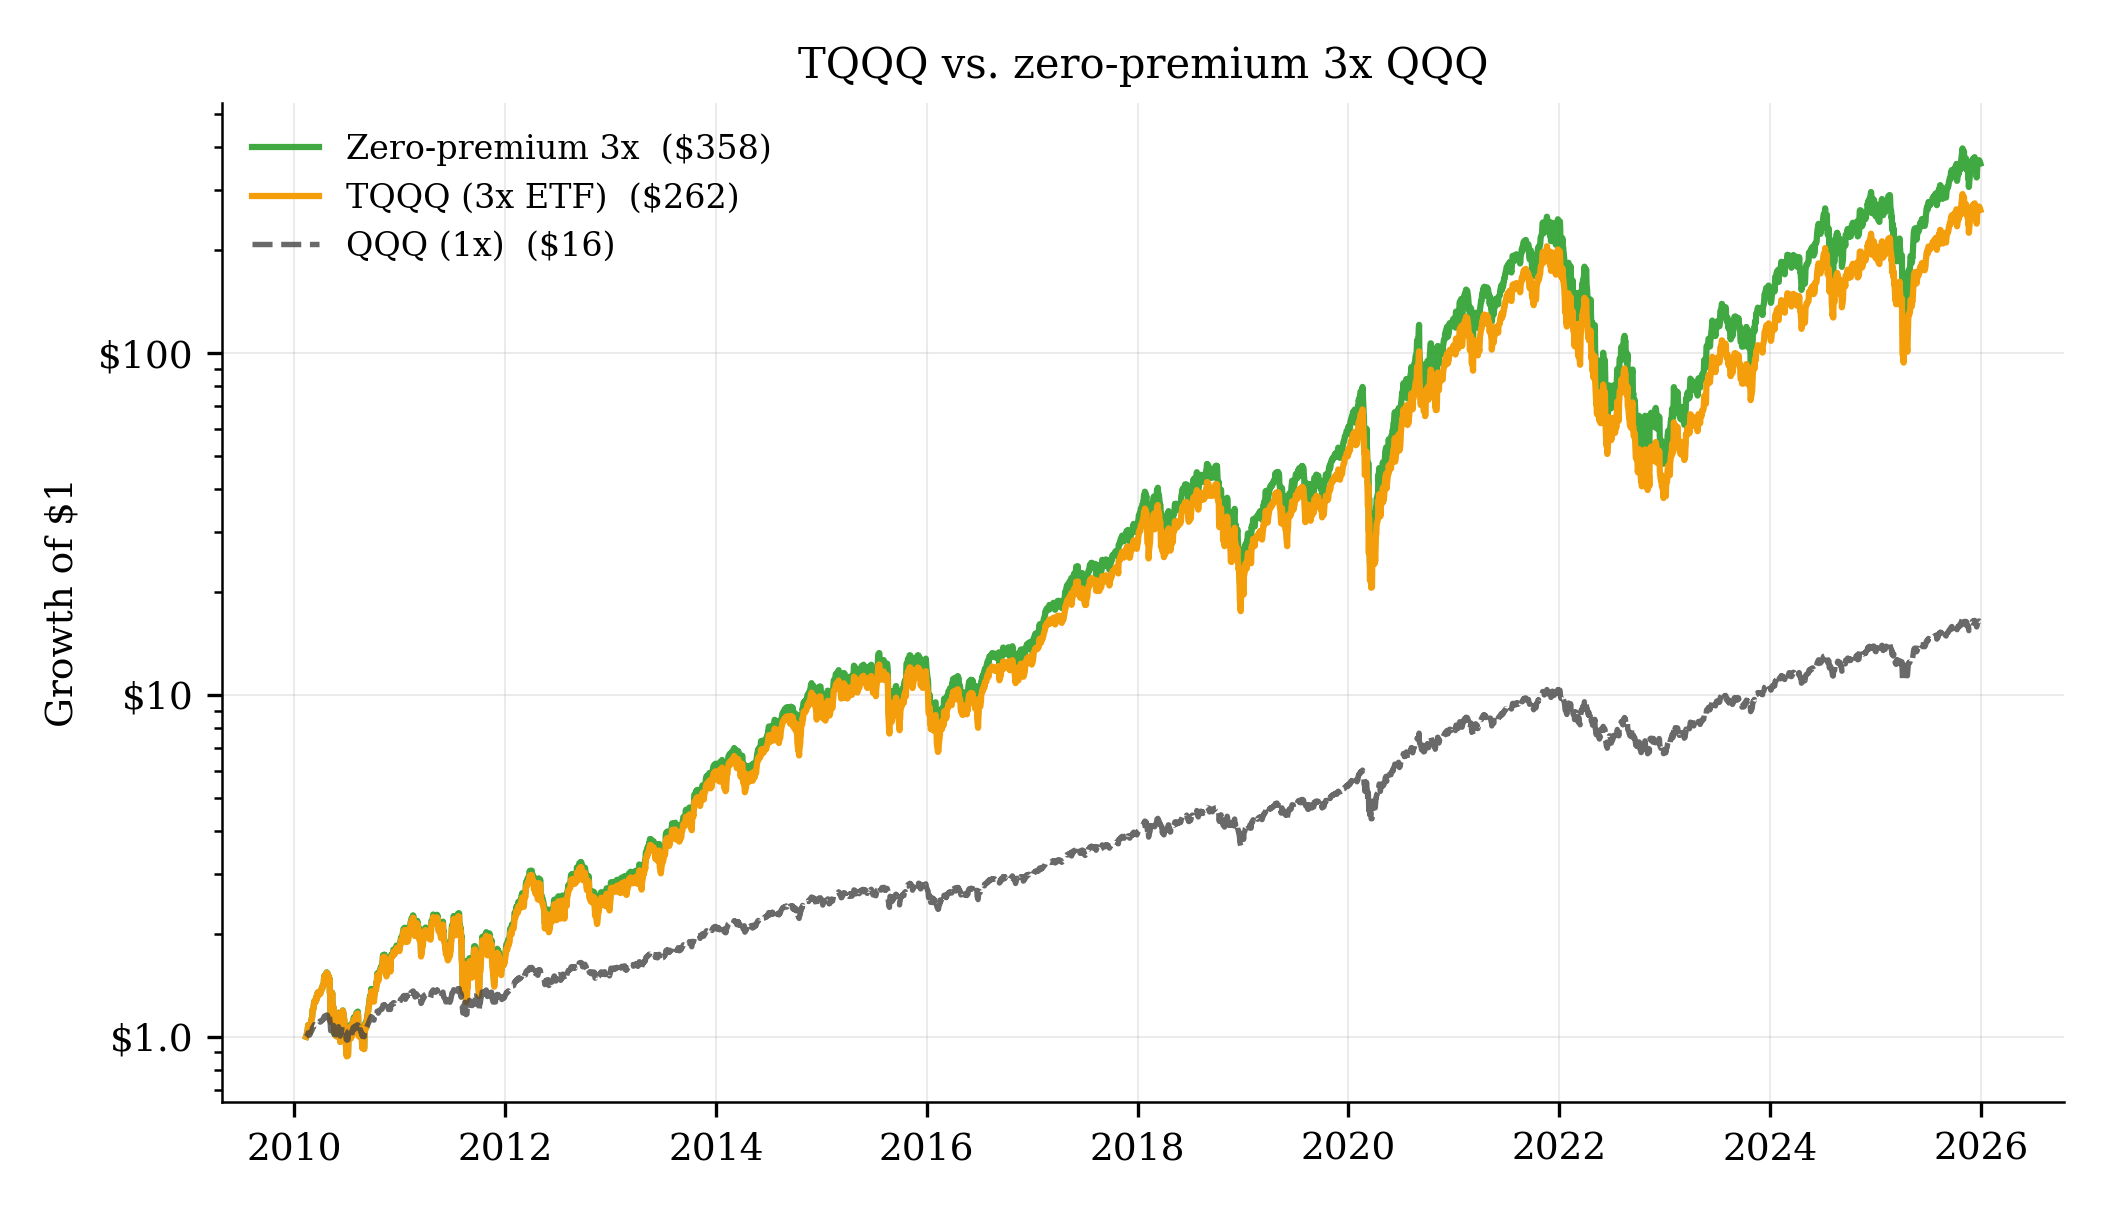
Take TQQQ, the largest and oldest 3x fund. Over the past 16 years it turned $1 into $262. An extraordinary return. But a 3x QQQ portfolio with zero financing premium would have delivered roughly a third more.
The stated expense ratio on TQQQ is 88 bps. The total financing premium is roughly double that. And TQQQ is one of the cheaper LETFs in the market.
You might expect competition to compress these costs. It does not. Three competing 2x Nvidia ETFs (NVDL and others) from different issuers have premiums ranging from 10% to 28%. Same underlying. Nearly identical labels. Very different economics.
Scale does not help either. TSLL’s premium nearly tripled as its AUM grew. TQQQ grew to $29 billion and the financing premium has barely budged in 15 years. From the dealer’s side this makes sense. Hedging a modest amount of notional is easy. Hedging tens of billions is a different problem.
For buy-and-hold investors, the compounding drag is the real price of leverage — and it is nowhere on the label.
The full per-fund breakdown is in the paper and interactive dashboard below. Hat tip to Sumit Roy whose original article on LETF financing costs inspired this analysis.
Additional reading: